Every rate cycle a board is asked how its rates compare, and to whom. Answering means locating each peer's rate schedule, reading it, and converting it into a common form by hand, which is why the comparison arrives inside a paid rate study or a staff assignment running months.
whatwatercosts.org, assembled by one engineer from documents utilities already publish, matched hand-collected cost tables across 99 utilities. No utility filed anything, adopted a schema, or changed a format. The standardizing happens in the pipeline rather than at the agency.
Automated search located fewer than half the utilities on its own. A published link, with the date a board adopted the schedule and the date it took effect, takes less than one staff afternoon and requires no vendor, no procurement, and no change to any document.
Read the full report
Water is a human right. It is also a spreadsheet problem. The price of water is a consequential number to households and a pillar of large-scale resource management planning. Up until recently, it has been difficult and costly to compare water prices.
Water agencies use comparisons to set fair rates, inform customers and defend increases. But that data is expensive. It is collected and managed by hand, which means a simple search query can cost hundreds of thousands of dollars in consulting fees across utilities.1
Standardization – making everyone use the same sensors, processes and data formats – has been the traditional approach to solving this problem. It’s been a tough road. Water suppliers, governments and activists in California have worked for decades to streamline reporting and assemble water prices.
Data-sharing initiatives that reached full coverage in other public sectors had either i) a strong central regulator or ii) a large commercial buyer of the data. Water agencies have neither. Existing filing regimes collect one-time, hardcoded numbers rather than the policies and calculations that produce them. No regulator or commercial player is large enough to force a change. Without those, collective action is a matter of chance – not hard work.
Large language models (LLMs) open a different path to understanding water. Extraction and formatting are now automatable with non-standardized data. The new challenge is how to discover the documents that contain it. Solving this challenge could save utilities and taxpayers millions of dollars.
This report breaks down water pricing and recurring frictions in public sector data initiatives. It also includes an analysis of whatwatercosts.org – an open-source project, made by a single person, holding residential rates for hundreds of utilities across the United States – as a case study in the shift from standardization to discovery. After the case study, this report provides three specific actions to make rate data discoverable and usable. These actions work with existing utility publishing processes and state submission systems, open up a new design space of composable applications, and could reduce state dependence on large, external consulting firms.
Section 01
How do California water suppliers price their water?
Every rate increase a California water utility proposes ends up in the same room. The board is seated, the Proposition 218 protest period has run,2 and somebody asks how the proposed rates compare to neighboring agencies and which agencies were chosen for the comparison. Those are fair questions and rightly asked in public. Answering them well is one of the more expensive things a utility does that produces no water.
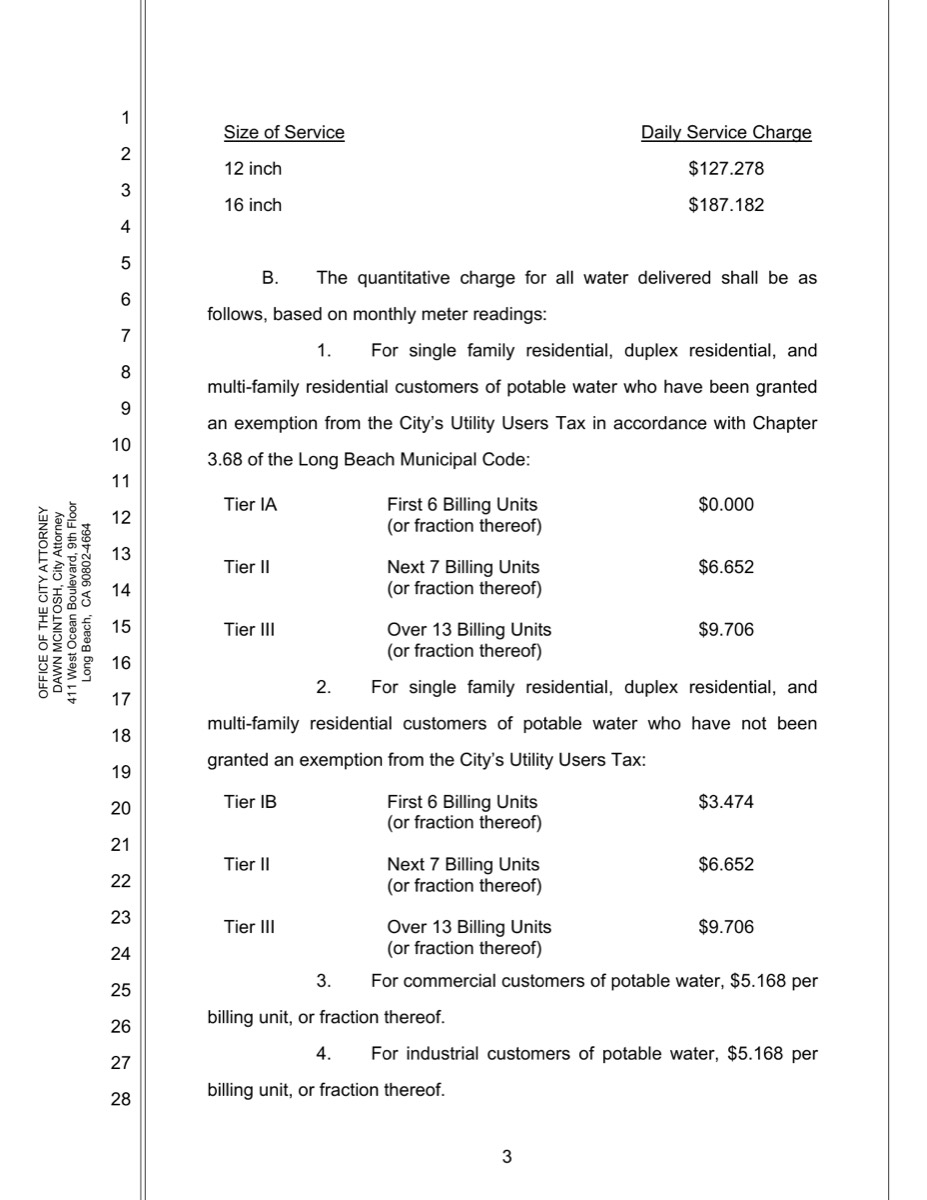
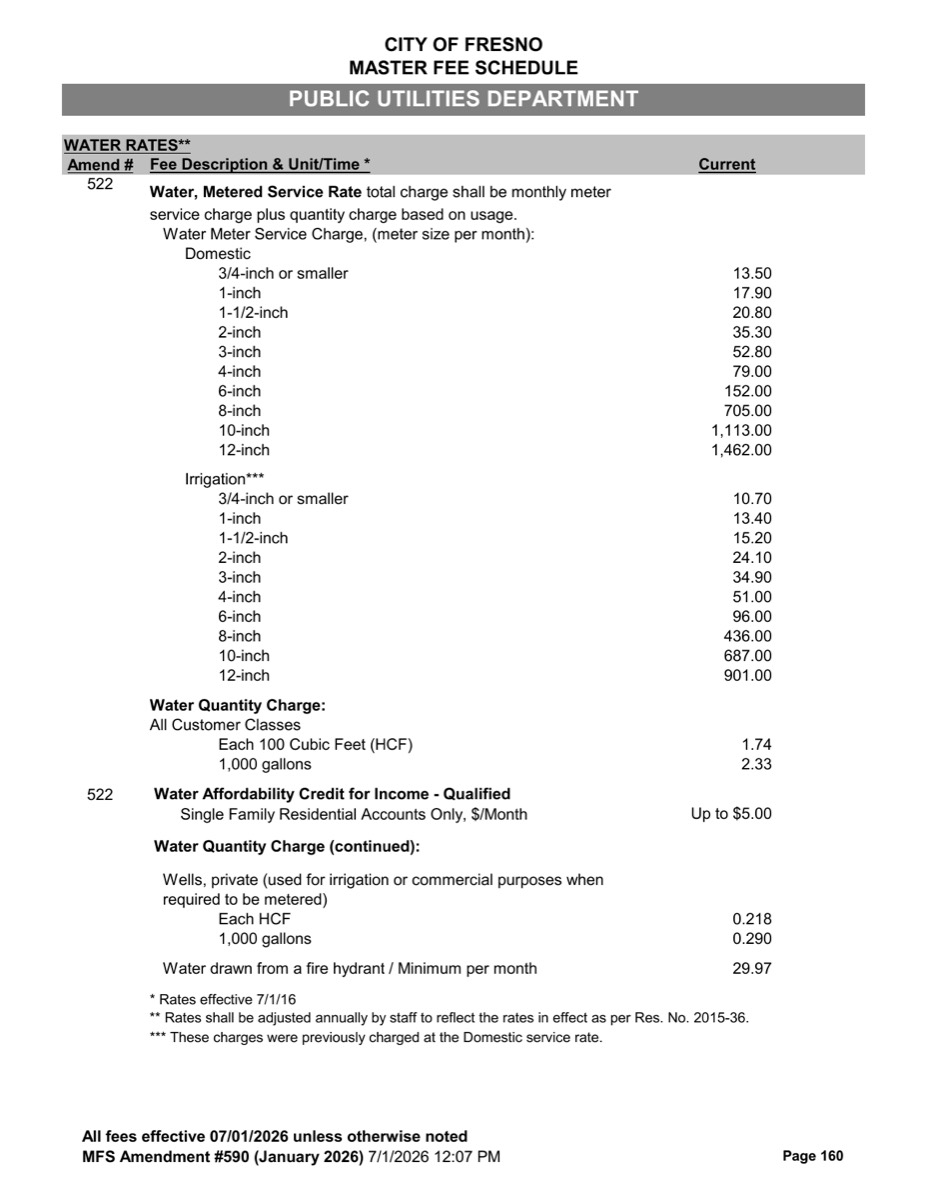
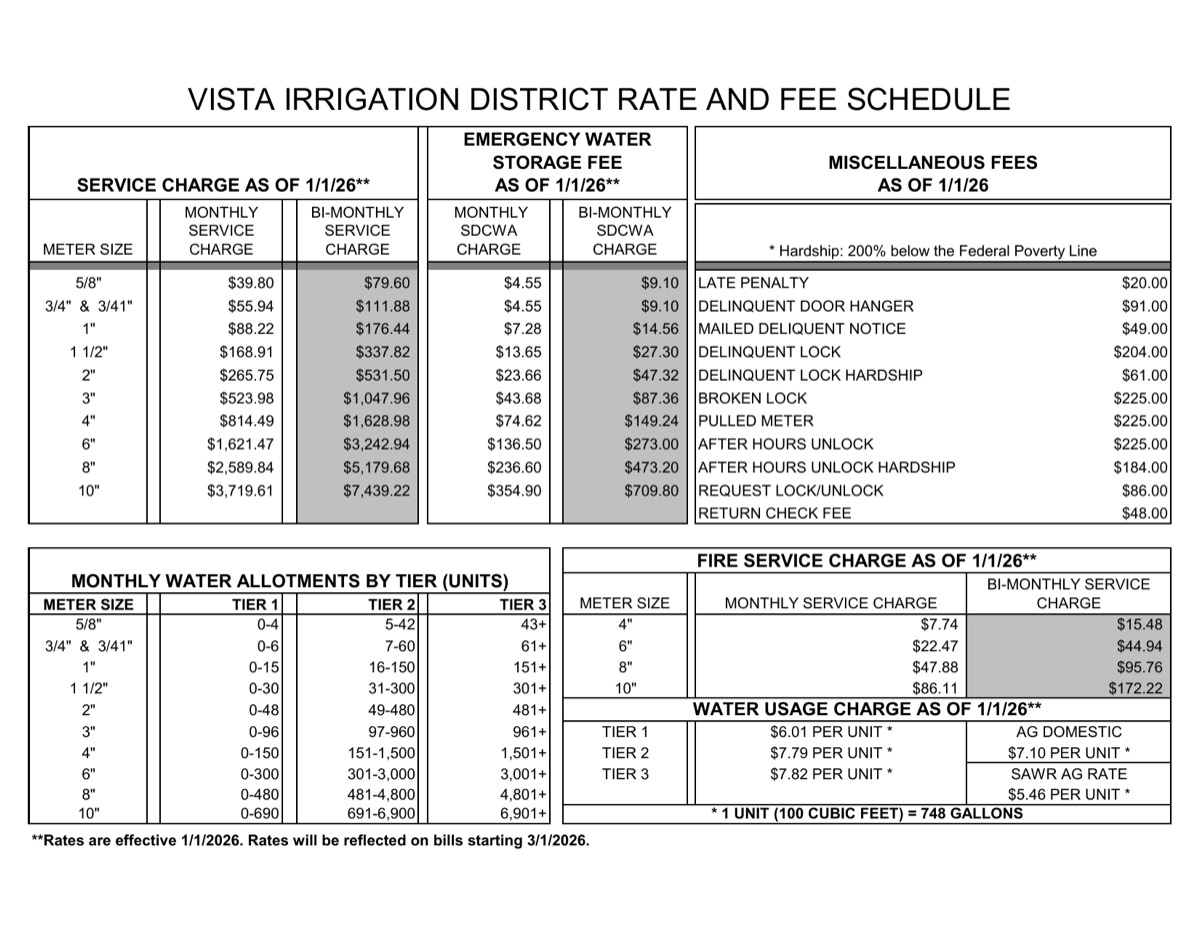
Rate cycles run one to three years, and up to five, so the question comes around often enough to be a standing cost and rarely enough that nobody builds a permanent capability for it. The reliable way to answer it has been to prepare the data by hand, either through a consultant or by assigning a staff member to the work for several months. Neither approach produces anything reusable. The next cycle starts over.
The eAR collects a utility's tier structure but not the context behind it
Every public water system in California is required to file rate data; filing is mandatory and tied to funding eligibility. There are six requirements: the electronic Annual Report, the Urban Water Management Plan, the water loss audit, conservation reporting, and two further reports added under SB 606 and AB 1668.
Section 8A of the electronic Annual Report asks for a utility's most common residential rate structure.3 A water utility selects its structure type, its billing frequency, and its unit of measure. It then fills a grid recording the base rate, the upper bound of each consumption tier, and the cost per unit within it, once for single-family customers and again for multi-family.
The instructions ask for the rate that applies to most residential customers, at the most common meter size, and for an annual average where a rate varies through the year. The form does not include other customer classes, variation by meter size, or seasonal and drought adjustments. The reasoning behind an allocation is compressed into a free-text comment or not included at all. Filing records what the rates are but does not record which document they came from, when a board adopted the rate change, or when it took effect.
Meanwhile the source documents contain all of these components, because a utility writes them to run its own business rather than to answer a survey. Desk research suggests utilities are not strongly opposed to correcting the survey itself, and no party to it has been careless; the obstacle is the cost of modifying highly customized state data systems at systems-integrator rates.4
| Customer Class & Billing Tiers |
Base Rate | Usage Rate Structure Top Metric / UOM |
Cost per Unit of Measure |
|---|---|---|---|
| Single-family — Tier 1 | 25 | 2 | 0.00 |
| Tier 2 | do not fill | 4 | 5.00 |
| Tier 3 | do not fill | 12 | 5.50 |
| Tier 4 | do not fill | 18 | 8.00 |
| Tier 5 | do not fill | 11.00 | |
| Multi-family — Tier 1 | 10 | 4 | 5.00 |
| Tier 2 | do not fill | 12 | 5.50 |
| Tier 3 | do not fill | 18 | 8.00 |
| Tier 4 | do not fill | 11.00 |
- Rate schedule
- The adopted document these figures were read from, stating the utility's charges in full. The filing records no URL, filename, or citation identifying it.
- Adopting resolution
- The board action that puts a schedule into force, carrying a number and a date. It is what distinguishes an adopted schedule from a draft or a rate study.
- Effective date
- The date a schedule begins to govern billing, together with the schedule it replaces. Without both, a document found today cannot be shown to be current.
- Non-residential class
- Commercial, industrial, institutional, and irrigation customers, each billed on a structure of its own that the residential table has no room to record.
- Meter-size variation
- The scaling of base charges by service connection size. The form asks for the rate at the system's most common meter size, so the remaining sizes are not recorded.
- Seasonal variation
- Rates that differ across the year, typically higher in summer. Where a rate is affected by season, the guidance directs the system to report an average.
- Drought stage and pass-through
- Conditional rates that take effect when a shortage stage is declared, along with surcharges recovering wholesale supply costs, both of which change what a customer is actually billed without appearing in the filing.
- Allocation logic
- The calculation assigning each household an efficient-use budget under a budget-based structure. The tiers are recorded; the derivation appears, at most, as a free-text comment.
Transit reached near-complete coverage through Google Maps and energy through FERC; water has neither lever
Several sectors have reached the coverage that water has not. Transit converged on GTFS, energy on tariff filing at the Federal Energy Regulatory Commission, and health records, UK banking, and Australian water resources each found their own route.5
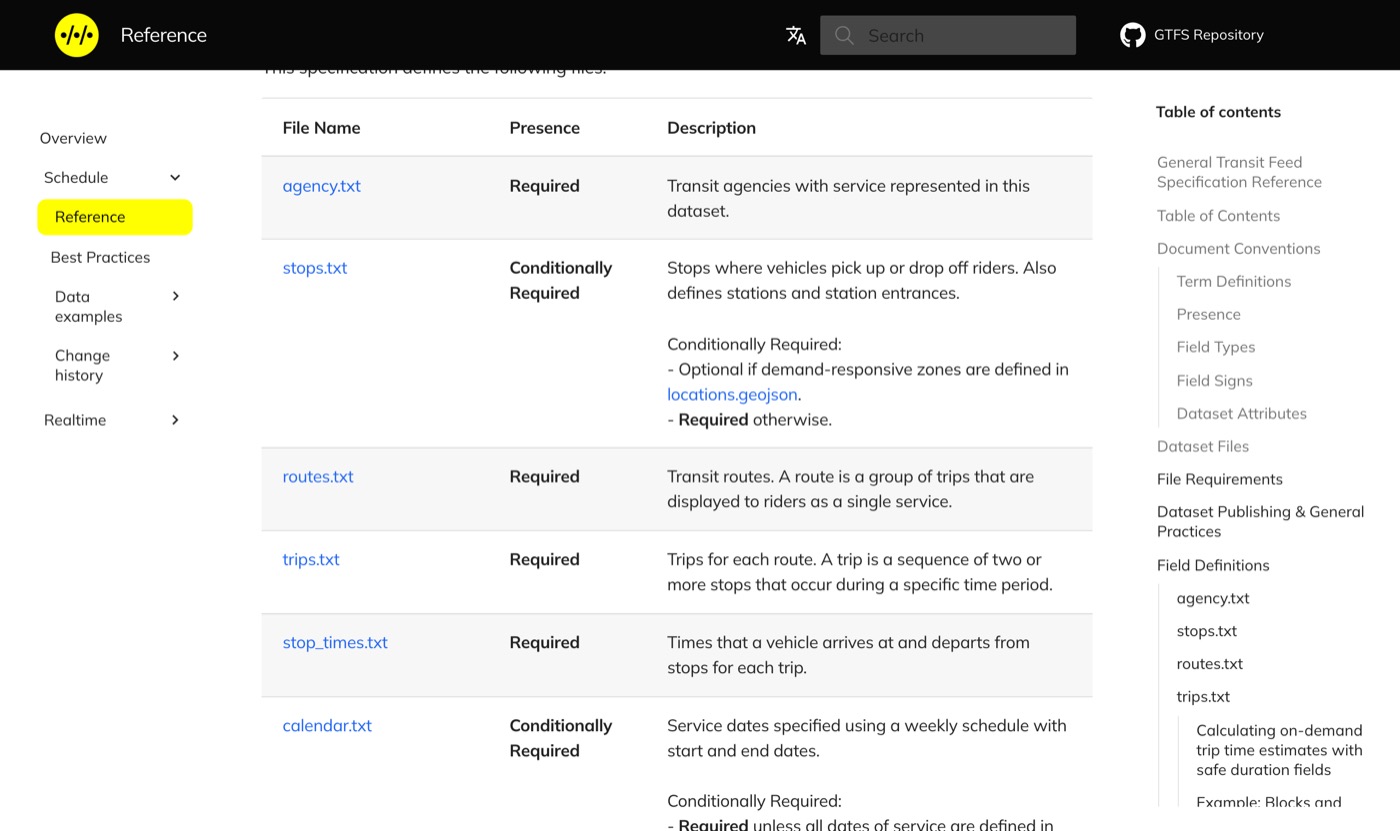
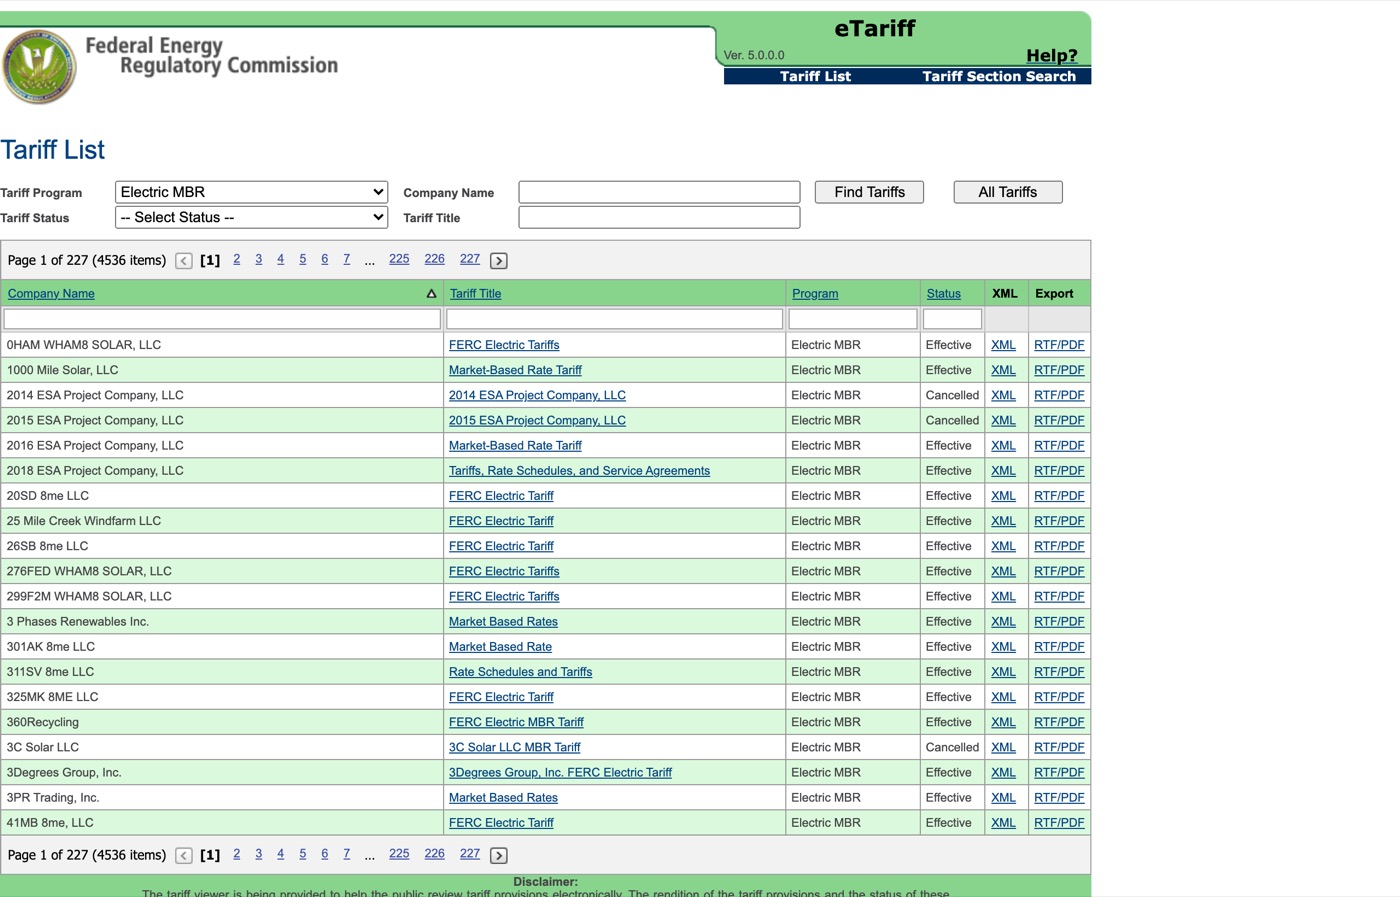
Transit agencies published schedules in a common format because Google offered a free listing in Google Maps to any agency that did, and Google Maps was where their riders already were. The pull came from a commercial consumer large enough that joining was worth the work. The specification itself was deliberately kept as plain CSV so that any agency could edit it in a spreadsheet; it was criticized as technically old-fashioned and succeeded anyway.6 Energy tariffs became uniformly available because FERC required regulated utilities to file them, from April 2010, and the filed copy is the only legally operative one.7 The pressure came from a regulator with authority over every publisher.
California's water utilities sit outside both mechanisms. Publicly owned systems make up 54% of the roughly 49,700 community water systems nationally and serve 88% of the customers,8 and no commercial player derives enough value from their rate data to force the issue. A filing requirement does exist, and it collects a summary rather than pointing at the source. Continuing to imitate transit and energy, or other industries, is unlikely to produce a step change.
The 2018 rate standard didn't reach adoption because it required new technical capabilities
The Open Water Rate Specification, an award-winning initiative, was published in 2016 and won the state Water Data Challenge in 2018.9 It demonstrated a path towards a shared database of California water prices on the model of the energy sector's Utility Rate Database, and towards the analysis that becomes possible once rates are machine-readable: bill calculators, revenue and equity comparison across utilities, and affordability analysis joined to census data. Four analysis tools were built against it, and it supplied the 2017–2018 CA-NV AWWA rate survey.
Yet adoption lagged, because participating was too difficult. Submitting a rate structure meant working through a GitHub pull request, which is a technical capability most water agencies do not have and have no reason to acquire. The initiative didn’t stick: forty rate structures were merged in March 2017 during a hackathon and the repository accumulated 500 specified utilities in total, but contributions stopped in April 2018. Subsequent work on the submission interface did not move the number further. This suggests that adoption follows the cost of participating, not the quality of the specification.
Section 02
LLMs and AI software have collapsed the cost of data analysis
Language models read almost anything. A rate schedule issued as a PDF, an HTML table, or a JPG image can now be parsed and its figures extracted at a cost measured in fractions of a cent.
That capability completes a decade of water data work. Previously, making rate data machine-readable meant asking every utility to publish it the same way, because the only way software could read four hundred documents was for all four hundred to be written precisely alike.
Language models have made every utility’s non-standardized documents machine-readable, overnight. What remains is a second, separate challenge: finding the source document in the first place, and confirming that it is the one in force.
Identity, authority, recency and completeness are still needed
A model infers the rate structure from source documents, but is limited to what is written. As a result, it cannot extract facts about a document's relationship to the world. For example, it cannot know whether a rate schedule is outdated unless another document states it, or a utility itself publishes the information in another way.
| What must be known | Where that fact actually lives |
|---|---|
| Identity | In a registrar's records. A rate schedule does not state which state system identifier the publishing agency holds, so matching a document to an agency is a lookup rather than a reading. |
| Authority | In the minutes of a board meeting. A document may assert that rates were adopted, and where it does the assertion can be stale or absent. |
| Recency | In the existence of a later document that has not been seen. Nothing in the schedule in hand reports that it has been superseded. |
| Completeness | In the list of who should have published. A process that reads only what it found cannot report what it missed, because absence produces silence rather than an error. |
Improvements in model capability make reading steadily cheaper, but extraction will remain limited to what has been published, then discovered.
The gap is small. It requires an address for the source document, the date a board adopted it, and the date it took effect. That is a fraction of what a full data specification requires and history indicates that the effort to close the gap determines whether this sector adopts anything.
A decade went to the format problem, and none to the location problem
Two independent conditions determine whether a utility's rates can be assembled into a dataset. The first is the format of what it publishes. The second is whether a third party can locate where it published. A decade of effort has gone into the first, with the results already described, because changing it asks each agency to restructure its documents, its systems, and its staff skills. Comparatively little effort has gone into the second, which asks for one line: a URL the utility already maintains for its own customers, published where a machine can read it.
Sorting the sector's options by who initiates the transfer, and by whose form the material takes when it arrives, produces four positions.10 California water rate reporting occupies one of them today.
Deposit
The agency transmits the operational artifact itself, unshaped.
- Public Records Act responses
- SEC EDGAR filings
Publication and discovery
The agency posts what it already produces; the consumer locates it and imposes structure afterward.
- whatwatercosts.org
- FERC eTariff
Mandated submission
The agency computes a figure to a specification it did not write and files it on a fixed cycle.
- eAR Section 8A, rate structure as free text
- Federal tax returns
Commissioned collection
A consumer pays someone to gather a fixed field set from wherever it can be found.
- A rate study's benchmarking task
- Manual academic rate surveys
The known failure of the publication and discovery position is the swamp, where the material is all present and nobody can find or trust any of it. The standard mitigation is a catalog or registry that carries the location and provenance of each source document.
Section 03 · Case study
whatwatercosts.org put 62% of bills within $5, but found only half the utilities
whatwatercosts.org is an open-source project holding residential rates for hundreds of utilities across the United States; its author later joined this team.11 It is a proof of concept rather than infrastructure, assembled from the PDFs and web pages utilities already publish, seeded from the federal system list and utility domains.
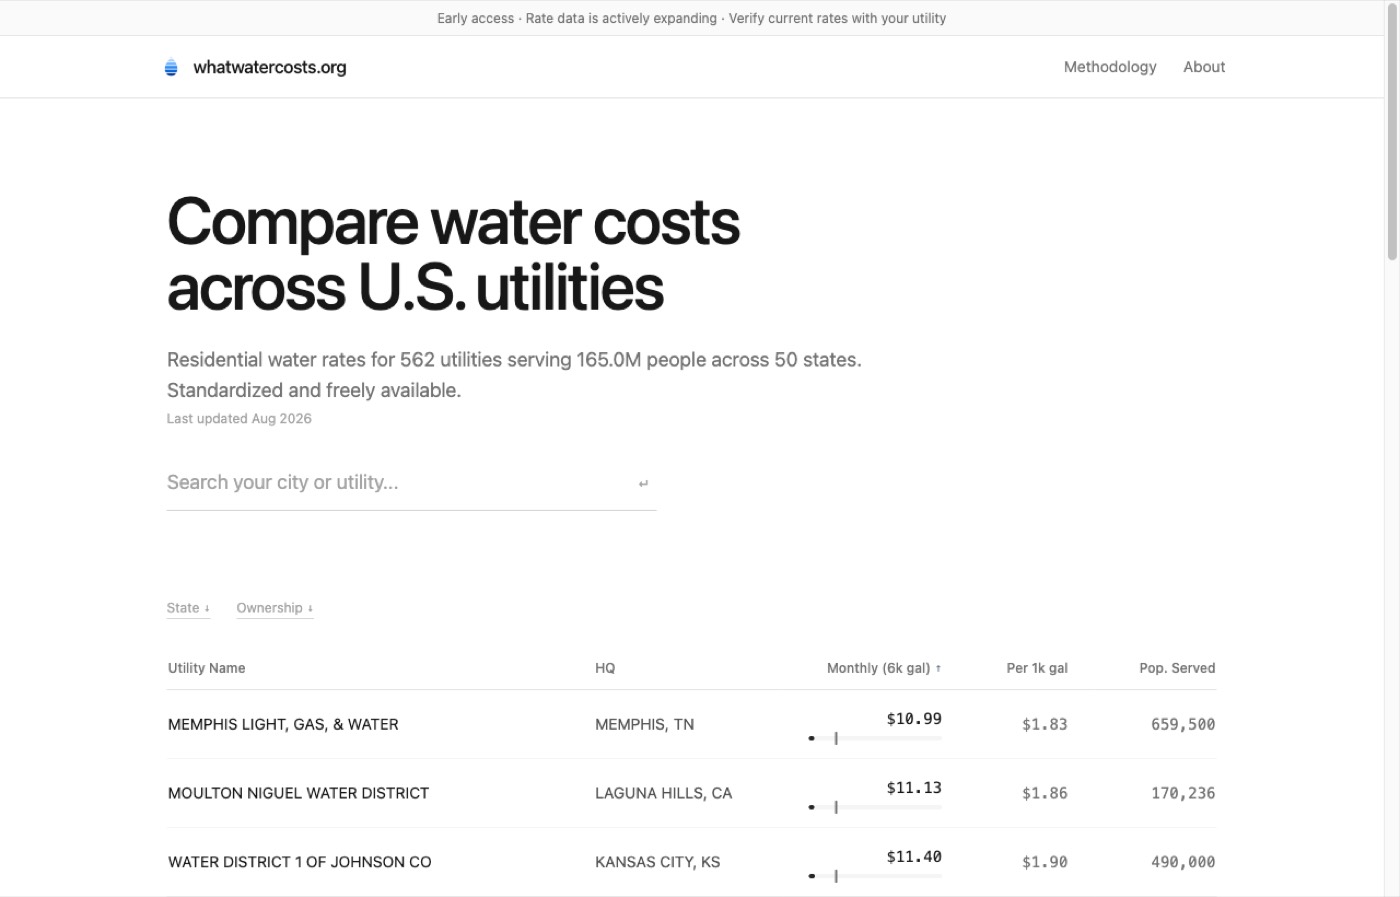
This side project, assembled by a single engineer, is a dataset the sector has treated as part of a six-figure procurement effort. The falling cost of reading rate sheet data made this project possible on a shoestring budget. No utility changed a format, adopted a schema, or filed anything. No custom IT system, internal policy, or staff training changed.
Conversion into a structured, comparable form happens automatically in the pipeline rather than by hand at the agency, with the output stored in a JSON refactoring of the Open Water Rate Specification, so the standardization work moved to the consumer side rather than disappearing.
Nearly two-thirds of the bills landed within $5 of a hand-collected dataset
The pipeline was validated against the North Carolina Environmental Finance Center's FY2026 cost tables across 99 utilities, comparing a standardized bill at 6,000 gallons per month.12
Accuracy on the utilities the pipeline reached is already comparable to collecting the data by hand. Coverage and verifiability persisted as the gap. Utility data that could not be found on the web could not be included, and data that was found was not directly validated as current by each utility. The coverage gap is measurable, because when the source document's URL is supplied in advance, the cost per utility falls from $0.028 to $0.003 and coverage approaches complete.
Once the rates exist as data, the applications are close to free. Three already exist in the Open Water Rate Specification ecosystem: a household bill calculator, a cross-agency rate comparison, and a model of revenue and typical-bill impact for a proposed rate change.13 Each was straightforward to build once the underlying data was available, and each is currently limited to the handful of utilities whose rate structures were specified by hand.
The lookup that follows draws on the same data.14 It was assembled from the export in an afternoon, and it is the whole argument in one object: the rates are real, no utility did anything to put them there,15 and whether any given figure can be checked depends entirely on whether a source document was recorded.
The project was limited by coverage and maintenance responsibilities
The project has two main limitations in scope and data reliability.17 The seed list is filtered to systems serving 10,000 people or more, which excludes exactly the segment where the state's SAFER program records the concentration of failing and at-risk systems. And the federal list supplies database names rather than the names a utility is known by locally, so matching a record to the agency a reader recognizes is not always straightforward.
A third limitation is maintenance. A dataset that a sector comes to rely on should not depend on one volunteer's continued interest. Instead, utilities should publish their source documents at reliable addresses, so that analysis and applications, including ones that do not exist yet, can be built on utility-verified sources.
Section 04
Become discoverable by publishing the source document's address
Something will answer the rate question whether or not utilities take part
Households are already directing rate questions to AI assistants, and those assistants answer from whatever they can find. Rate data is public information, so a utility loses nothing by making it discoverable and improves the chance that an assistant answers from the most up-to-date, official record.
For example: several AI assistants already cite whatwatercosts.org rather than working the figures out independently. Something will answer the question of what water costs, and why, whether or not agencies participate in data discovery. The key question is whether the answer reaching water customers – locally, and at state and national level – originates in a source the utility stands behind.
The address therefore has to come from the utility rather than be inferred by whoever is collecting. If the collection side carries all of the work, then whoever runs the best pipeline becomes the effective authority on what every utility charges, which places a public fact under private control by default rather than by any decision. A published address reverses the relationship: the aggregator becomes an index, and the utility remains the author of its own numbers.
Three actions follow. Together they do one thing: they publish the address of the rate schedule a utility has already written, along with the date a board adopted it and the date it took effect. None of them changes the format of any document a utility publishes, and none requires a change to a state submission system.
| The action | Who acts, and the board's part in it | What it costs | What it unlocks |
|---|---|---|---|
One · Publish the current rate schedule at an address that does not move, with the date a board adopted it and the date it took effect, and list that address in the site's sitemap.xml. |
The utility. The board directs staff. No vendor, no procurement, no state involvement. | Less than a single staff afternoon, then a few minutes each rate cycle. | Rates become findable and checkable by anyone answering a question about them, including the utility's own customers. Roughly 60% of civic domains already serve a sitemap, so for most utilities this is a configuration change rather than a new capability. |
| Two · Record that same address, with its two dates, as one field in the electronic Annual Report. | State Water Board. A board's route is to ask for it through the associations it already belongs to. | A single field on a form that already exists. | Statewide coverage, inherited from a mandate that already exists and is already tied to funding eligibility. |
| Three · Publish a certified crosswalk between the state system identifier and the other identifiers a utility appears under.18 | The California Data Collaborative, as the sector's coordinating body. | Coordination, and the benchmark work already underway. | Records can be matched to the right agency reliably, so one place to look actually resolves to one utility. |
Only the first is a board decision in the ordinary sense, and it is the one that produces most of the benefit. The second would settle the matter permanently and is a request to the state rather than something a board does directly. Whether the current Section 8 schema can carry such a field is being confirmed.
The ask is a URL, an adoption date, and an effective date
Nothing about the rate schedule itself changes. What is added is a statement of where it lives and what a board did with it.19
Example · a utility's published source-document address
# https://www.example-water.gov/llms.txt

# Example Municipal Water District
PWSID: CA1910xxx

## Rates
- Current residential rate schedule: https://www.example-water.gov/rates/schedule-2026.pdf
  Adopted: 2025-11-18 (Resolution 25-114)
  Effective: 2026-01-01
  Supersedes: /rates/schedule-2024.pdf
Recording whether a board adopted the document an address points to, and when it took effect, is the same move that EDGAR and FERC already make. EDGAR stamps each submission with a filing type and an acceptance time and threads later amendments back to the original, and FERC derives which tariff is currently effective from filed effective dates and supersession. Both systems answer the currency question with a recorded field rather than by inference, which is the only way it can be answered reliably.
A pilot is testing whether the index can be assembled this cheaply
None of this needs to wait on the actions already set out, and a first attempt is under way.20 A crowdsourced collection is being run across the 455 California community water systems serving 10,000 people or more, which together cover roughly 37 million residents and the large majority of the state's metered connections. Two independent researchers work the same list, recording each utility's official domain, the direct URL of its current residential rate schedule, the effective date, and the apparent update cycle. Most utilities take one to two minutes. Disagreements between the two are resolved by the project team, and the rate at which they agree is itself reported as a measure of how findable this material is.
The budget for that collection is approximately $650, funded by four contributors at roughly $165 each.21
That figure buys a one-time collection of addresses by two researchers, and it is not the cost of a working registry. It excludes verifying what those researchers found, keeping the addresses current as rates change, and resolving disagreements about which document is authoritative. It also excludes whatever running the result as a dependable service would cost. It is evidence that the first step is cheap enough to attempt rather than a price for the finished thing. The collection is designed to test three things: whether extraction coverage rises above 90% once URLs are known, how accurately automated discovery finds those URLs without help, and what the floor of participation is, meaning how often a rate document can be found when a utility publishes nothing but its domain. The third question matters most for policy, because it establishes the smallest thing a utility could be asked to do.
The results and the dataset are to be published openly, including the cases where the approach does not work, since the value of the exercise depends on reporting those as well. If the California results hold, the project plans to extend extraction to the largest two thousand systems nationally over the following six months, calibrated against the California ground truth. The index of source-document addresses would then be published as open data, with a route for utilities, researchers, and practitioners to submit and correct entries.
Supporting the work
The California Data Collaborative developed the Open Water Rate Specification this work proceeds from, and the project team has presented through the Collaborative’s streamlined reporting task force. A utility that already publishes its rate schedule at a stable address can submit that link directly. A utility interested in the benchmark collection described above, or in the broader effort to streamline water data reporting in California, can reach the Collaborative.
None of this depends on the technology getting better
The case so far rests on cost: a pilot in the hundreds of dollars against rate studies that run from forty thousand to six figures. That gap would hold even if model quality froze today, because the saving comes from not re-deriving structure by hand.
The same logic covers the planning-horizon question. A pipeline built around current models is a reasonable worry for a sector that plans in decades, but the recommendation is not a pipeline. It is an address, and two dates tying the record to the right agency, the facts that make a retrieved rate canonical by establishing identity, authority, recency and completeness. Because that artifact is data rather than a tool, it holds regardless of which model reads it, so there is no vendor lock-in and nothing to future-proof.
robots.txt and sitemap.xml. The Protocol Institute brand kit this report is built from publishes one.Section 05
Urban water plans and groundwater reports face the same test
Any public reporting domain can be sorted by two questions. Can the document be found, and how usable is it once found. Where documents are readable but scattered across independent publishers, findability is now the limiting factor and further work on submission standardization has limited upside against what automated extraction already does. Urban Water Management Plans, groundwater sustainability plan annual reports, and water loss audits all sit here, as does a great deal of municipal reporting that has nothing to do with water. Where a regulator already requires filing, findability comes free, and accuracy and verifiability are the questions that remain.
The same pattern recurs elsewhere. Automated readers absorb variation in form, which removes the reason most standardization efforts existed. What they do not absorb is disagreement about identity, location, and currency, and those are settled by publishing small agreed facts rather than by restructuring documents. The work that remains after the technology arrives is smaller than the work that came before it, and it is a different kind of work.
The practical consequence for a utility is that data which is liquid supports analysis that was previously not worth commissioning. A bill calculator and a rate comparison were straightforward to build once the underlying rates existed as machine-readable data. The same will be true of questions nobody has thought to ask yet, which is the ordinary result of making something cheap that used to be expensive.
Appendix
Evidence and background
Both case sets are published in full. Between them they cover twelve systems in other sectors that faced a version of this problem, and the four sources this analysis leans on most.22
About
About this report and the Protocol Institute
This analysis was conducted by the Protocol Vision team, a research group of the Protocol Institute that helps organizations see how protocols and AI shape their operations. The team examines persistent problems within organizations and industries, the coordination entanglements that produce them, and the simple interventions that move the performance frontier. Water rates are one instance of a pattern the institute encounters repeatedly: an automated system such as the whatwatercosts.org pipeline depends for its accuracy on protocols it does not itself control, in this case a shared rate specification and an index of addresses each publishing agency stands behind.
For more about the Protocol Institute, and about how protocols shape our lives, visit protocol-institute.org.